Workplace Management KPIs for Flexible Offices: 10 Metrics Growing Teams Should Track
Growing teams make faster decisions when they measure the right things. In a flexible office, where headcount shifts, hybrid schedules vary, and workspaces serve multiple functions, the data that actually matters is different from what traditional offices tracked.
These are the ten workplace management KPIs that give you a clear, honest read on how your space and your people are performing.
Why KPIs Look Different in Flexible Work Environments
Fixed offices had a simple way to measure space: count the desks, fill them, and call it done.
Flexible offices do not work that way. The whole model is built on adaptability, which means the metrics you need are more dynamic too.

Research from ActivTrak shows that 75% of organizations now consider workforce analytics a core part of their strategy. Yet most still rely on outdated indicators that tell them very little about whether their workspace is actually supporting growth.
The solution is not to track everything. It is to track the metrics that connect workplace decisions to real business outcomes.
For teams based in coworking spaces, this is especially relevant. You are not locked into a ten-year lease, which means you have the flexibility to act on what the data shows. That is only useful, though, if you are collecting the right data in the first place.
The 10 Workplace Management KPIs Worth Measuring
1. Space Utilization Rate
This is the percentage of time your available workspace is actually in use. The formula is straightforward: actual usage time divided by available time, multiplied by 100. You can measure it for individual desks, meeting rooms, or entire floors.
A low utilization rate is a signal that you are paying for more space than you need. A rate that is consistently near 100% means your team may be running out of room and collaboration is being squeezed. Most operators find the operational target sits between 70% and 85%.
2. Desk Occupancy Rate
Desk occupancy and space utilization are related but not the same. Occupancy tells you how many desks are being used at a given time. Utilization tells you how often. Together, they give you a fuller picture of where your space budget is going.
Regus found that on average, 55% of office spaces go unused, costing companies upwards of $27,000 per desk each year. For growing teams with limited budgets, this is one of the most directly actionable numbers you can monitor.

3. Peak Occupancy Rate
Average occupancy can be misleading. An office that averages 40% occupancy might hit 90% capacity every Wednesday. If you plan your space around averages rather than peaks, you will run out of desks on the days your team actually comes in together.
Peak occupancy measurement matters most for hybrid teams. Track which days of the week see the heaviest attendance, then make sure your workspace provider can accommodate those peaks without friction.
4. Cost Per Seat
This is the total cost of keeping one active workstation running, covering rent, utilities, furniture, equipment, and services, divided by the number of seats in use. In tier-one urban markets, this figure can run between $10,000 and $18,000 per seat annually. In tier-two cities and flexible workspaces, the number tends to be significantly lower.
Tracking cost per seat gives you a concrete way to benchmark your workspace investment against the output it generates. It is one of the cleaner metrics for justifying a move to a coworking model or for deciding when to expand your space commitment.
5. Meeting Room Utilization
Teams that measure meeting room utilization regularly tend to discover two things. First, certain rooms are consistently overbooked. Second, others are almost never used. Both findings point to a mismatch between what the space offers and what the team actually needs.
Meeting room utilization is calculated the same way as general space utilization: time booked divided by time available. If you have rooms that sit empty most of the week, that is space your budget is absorbing without return. If your booking system shows rooms are at 90% capacity most mornings, that is a bottleneck waiting to slow your team down.
6. Member or Employee Retention Rate
High turnover is expensive in ways that go beyond recruitment costs. Teams lose institutional knowledge, momentum stalls during transitions, and morale takes a hit when good people leave. Organizations that prioritize effective communication are up to 4.5 times more likely to retain top-performing employees.
For workplace managers, retention is not purely a HR metric. The physical environment, commute convenience, quality of amenities, and sense of community all affect whether employees choose to stay. Tracking retention at regular intervals and correlating dips against workplace changes gives you useful data on what your space is contributing to the problem or the solution.
7. Employee Engagement Score
Engagement is measured through regular surveys, often using a Net Promoter Score format that asks employees how likely they are to recommend the company as a place to work. Teams that receive regular feedback show a 20% improvement in quarterly performance scores, and those with consistent engagement check-ins hit their quarterly goals at a significantly higher rate than teams that skip this process.
For flexible offices, engagement scores are particularly worth watching during periods of change, such as when a team moves locations, switches to a hybrid model, or scales rapidly. A dip in the score during a transition is an early warning that something in the environment needs attention.
8. Onboarding Efficiency
How long does it take a new hire to reach full productivity? This metric is rarely tracked with precision, but it has a direct effect on team output. A well-structured onboarding process supported by the right workspace, meaning a place that makes introductions easy, provides enough private space for orientation sessions, and puts new hires in proximity to the people they need to learn from, can cut ramp time significantly.
Research shows that effective onboarding directly influences both long-term retention and early performance. For growing teams that are hiring frequently, measuring how quickly people get up to speed is one of the highest-return KPIs to monitor.
9. Absenteeism Rate
Absenteeism is calculated by dividing total days missed by available workdays and multiplying by 100. A rising absenteeism rate can signal burnout, workplace dissatisfaction, or poor work-life balance. In a flexible office context, it can also point to a workspace that people do not find worth commuting to.
According to workforce analytics research, absenteeism often signals underlying issues that, if addressed early, are far less costly to fix than the eventual turnover they predict. Tracking it monthly gives you time to investigate and respond before the problem compounds.
10. Collaboration Frequency
This one is harder to quantify but worth the effort. Collaboration frequency measures how often team members are working together in person, whether through formal meetings, informal conversations, shared working sessions, or cross-team interactions. A Deloitte study found that 73% of employees who regularly collaborate report improved performance, and 60% say it sparks new ideas.
You can track this through meeting room booking data, calendar analysis, or simple team surveys. The goal is to understand whether your workspace is actively bringing people together or whether it is accidentally isolating them. Coworking environments, with their shared communal areas and diverse member communities, tend to score well on this metric relative to traditional private offices.
How to Use These Metrics Without Getting Overwhelmed
Not every team needs to track all ten from day one. A more practical approach is to pick four to six that match your current growth stage and measure them consistently over time. Workforce analytics specialists recommend choosing metrics that connect directly to your top business priorities, then expanding your tracking as your processes mature.
The pattern that works for most growing teams looks something like this:
Early-stage teams (under 15 people)
Focus on cost per seat, onboarding efficiency, and engagement score. These three give you the financial baseline, the talent pipeline health, and the culture signal you need at this stage.
Mid-size teams (15 to 50 people)
Add space utilization rate, meeting room utilization, and absenteeism. You are now at a size where space decisions cost real money and where team dynamics can fracture if left unmonitored.
Scaling teams (50+ people)
The full set of ten becomes relevant. At this size, retention and collaboration frequency become especially important. You are managing a community, not just a headcount, and the data should reflect that.
Turning These Metrics into Decisions
Collecting these workplace management KPIs is only the first step. The real value comes from reviewing them on a set cadence, whether monthly or quarterly, and connecting the numbers to specific team decisions. Is utilization dropping because collaboration days are unstructured? Is satisfaction low because the space is too loud? Are meeting rooms constantly unavailable because no-shows go untracked?
For growing teams in Ho Chi Minh City, the advantage of working from a professionally managed flexible office is that many of these data points are easier to gather and act on than they would be in a privately leased space. A strong workspace provider gives you the infrastructure, the operational support, and the flexibility to adjust as your numbers change.
The shift toward outcome-based workplace thinking is well underway. Teams that measure how their space performs, rather than simply occupying it, tend to make smarter scaling decisions, spend less on real estate waste, and retain people who genuinely enjoy where they work.
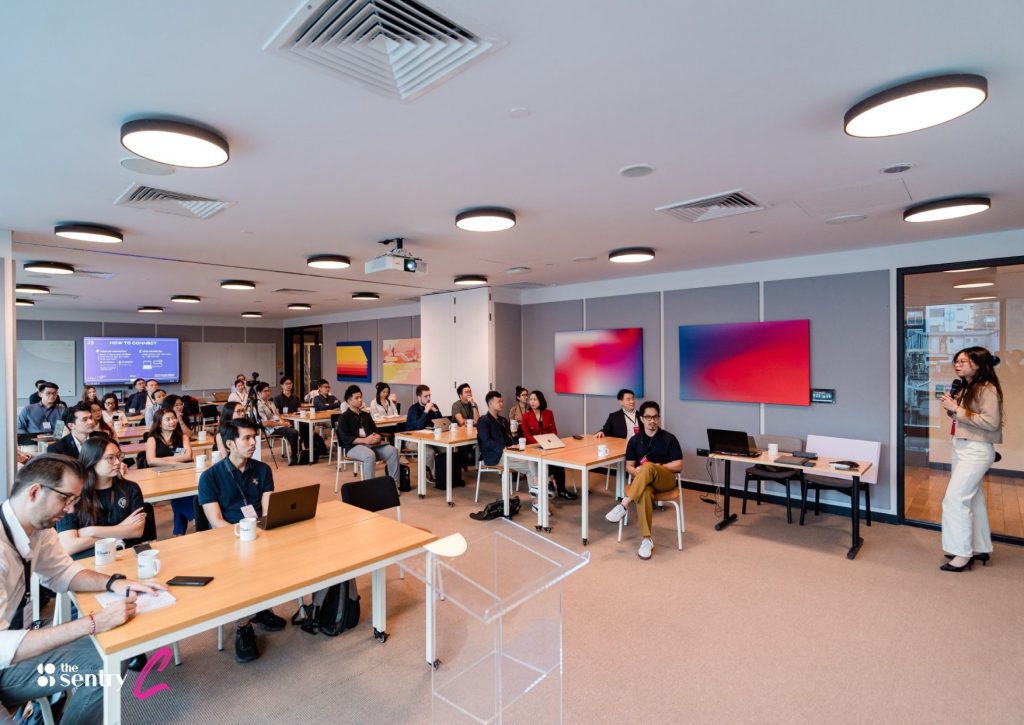
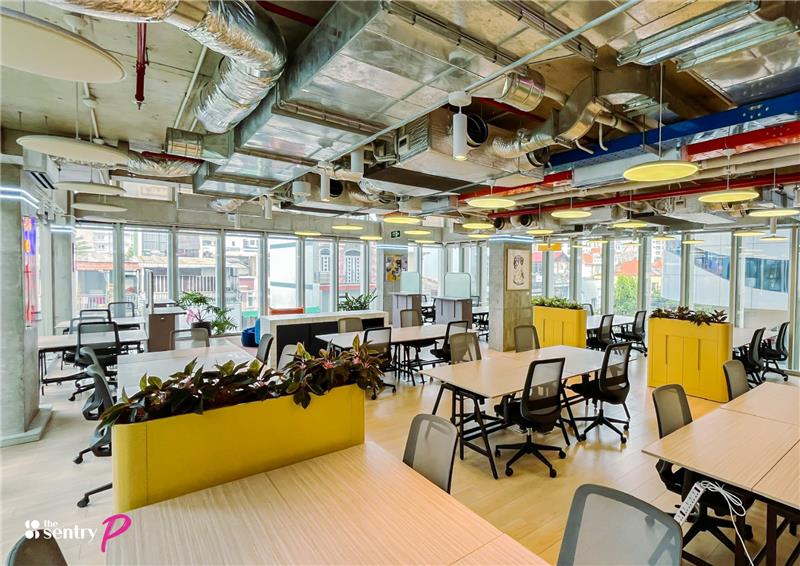
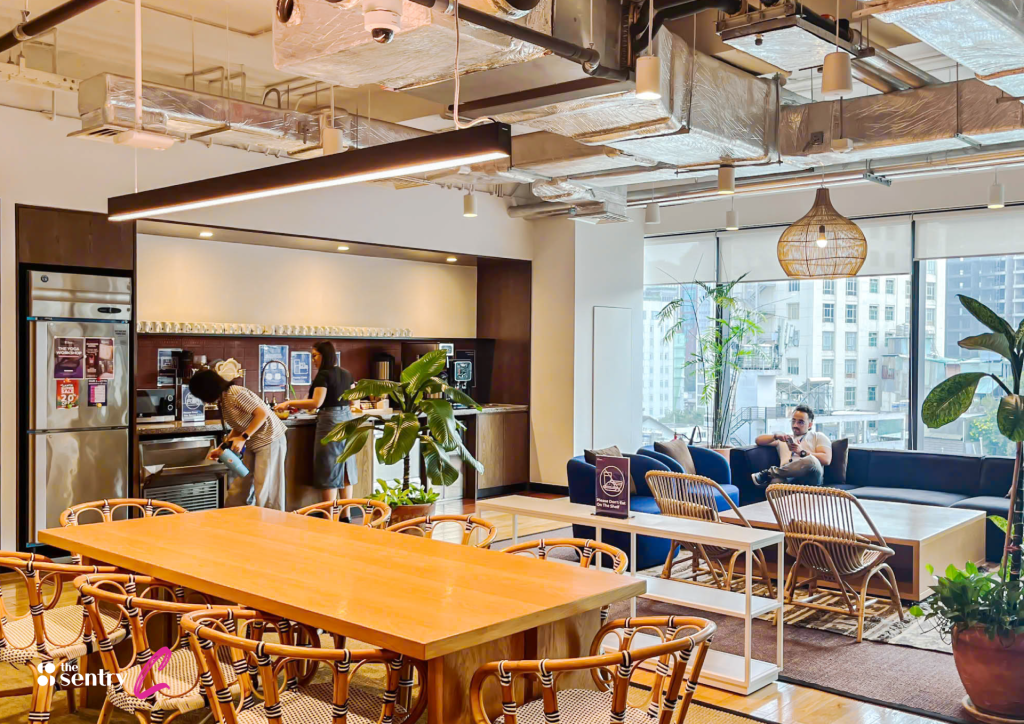
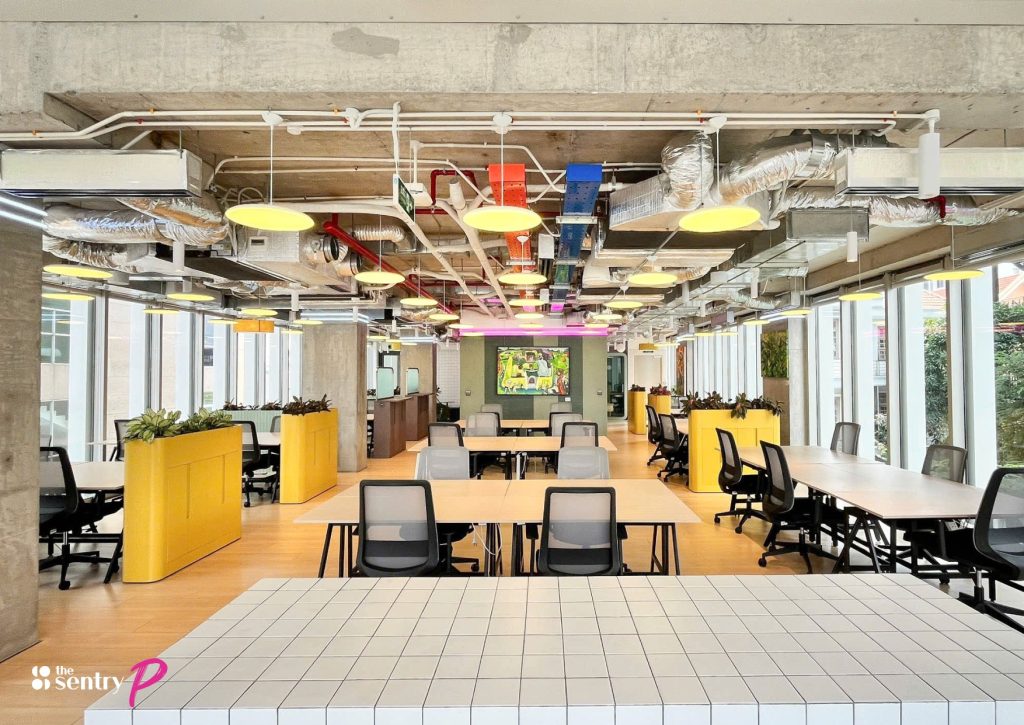
See The Sentry in Action
The Sentry offers professionally managed flexible office spaces across Ho Chi Minh City, built for teams that want great infrastructure, strong community, and the space to grow without locking into a long-term lease.
YOU MAY BE ALSO INTERESTED IN

How to Find the Right Office for Rent in District 7 & Phu My Hung
District 7 has turned into one of the more popular places to base a business in Ho Chi Minh City, and most of that pull comes from Phu My Hung. The area is clean and organized, the buildings meet international standards, and the rents sit well under District 1. Put those together and an office […]

How to Choose a Coworking Space in HCMC That Fits the Way You Work
Ho Chi Minh City has more coworking spaces than ever, and picking the right one comes down to a handful of practical factors rather than guesswork. The city saw roughly a 20 percent jump in coworking supply through 2024, going by market reporting from Vietnam Investment Review, so you have plenty of choice and plenty […]

How to Set Up a Virtual Office in Vietnam for Founders and Growing Teams
A virtual office gives your company a real address in a commercial building, someone to handle your mail, and a room to meet clients when you need one, without the cost of a desk you barely sit at. That mix has made the virtual office in Vietnam one of the cheaper ways for startups, incoming […]

Interested in this location?
Complete the form below to book a tour or connect with one of our team members to find out more.